使用 Prometheus Stack 监控 Etcd
前沿
默认部署好 kube-prometheus-stack ,如果Kubernetes集群采用了外部 etcd - 分布式kv存储 (例如: 部署TLS认证的etcd集群 ),那么 Grafana通用可视分析平台 中显示 etcd - 分布式kv存储 的内容是空白的。此时需要定制 values 并通过 更新Kubernetes集群的Prometheus配置,提交etcd相关配置(包括证书),这样才能对 etcd 完整监控。
通过 kube-prometheus-stack.values 配置 etcd 访问密钥
对于外部 etcd - 分布式kv存储 ,在 kube-prometheus-stack.values 有一段 kubeEtcd 配置,修订如下:
通过 kube-prometheus-stack.values 配置监控外部 etcd ,使用etcd客户端证书访问(类似apiserver)
## Component scraping etcd
##
kubeEtcd:
  enabled: true

  ## If your etcd is not deployed as a pod, specify IPs it can be found on
  ##
  endpoints:
    - 192.168.1.60

  ## Etcd service. If using kubeEtcd.endpoints only the port and targetPort are used
  ##
  service:
    enabled: true
    port: 2379
    targetPort: 2379
    # selector:
    #   component: etcd

  ## Configure secure access to the etcd cluster by loading a secret into prometheus and
  ## specifying security configuration below. For example, with a secret named etcd-client-cert
  ##
  serviceMonitor:
    scheme: https
    insecureSkipVerify: false
    #serverName: localhost
    caFile: /etc/prometheus/secrets/etcd-client-cert/etcd-ca
    certFile: /etc/prometheus/secrets/etcd-client-cert/etcd-client
    keyFile: /etc/prometheus/secrets/etcd-client-cert/etcd-client-key
    #caFile: /etc/kubernetes/pki/etcd/ca.crt
    #certFile: /etc/kubernetes/pki/apiserver-etcd-client.crt
    #keyFile: /etc/kubernetes/pki/apiserver-etcd-client.key
serviceMonitor:
...
    scheme: https  # 修改为https
    insecureSkipVerify: false
    serverName: ""
    caFile: /etc/prometheus/secrets/etcd-client-cert/etcd-ca
    certFile: /etc/prometheus/secrets/etcd-client-cert/etcd-client
    keyFile: /etc/prometheus/secrets/etcd-client-cert/etcd-client-key

    ## port: Name of the port the metrics will be scraped from
    ##
    port: https-metrics # 修改为https

    jobLabel: jobLabel
    selector: {}
    #  matchLabels:
    #    component: etcd

...
## Deploy a Prometheus instance
##
prometheus:
  enabled: true
...
  ## Settings affecting prometheusSpec
  ## ref: https://github.com/prometheus-operator/prometheus-operator/blob/main/Documentation/api.md#prometheusspec
  ##
  prometheusSpec:
    ## If true, pass --storage.tsdb.max-block-duration=2h to prometheus. This is already done if using Thanos
    ##
    disableCompaction: false
...
    ## Define which Nodes the Pods are scheduled on.
    ## ref: https://kubernetes.io/docs/user-guide/node-selection/
    ##
    nodeSelector:
      telemetry: prometheus

    ## Secrets is a list of Secrets in the same namespace as the Prometheus object, which shall be mounted into the Prometheus Pods.
    ## The Secrets are mounted into /etc/prometheus/secrets/. Secrets changes after initial creation of a Prometheus object are not
    ## reflected in the running Pods. To change the secrets mounted into the Prometheus Pods, the object must be deleted and recreated
    ## with the new list of secrets.
    ##
    secrets:
      - etcd-client-cert
    # 一定要配置 prometheus.prometheusSpec.secrets 添加 etcd-client-cert
...
上面 etcd 的证书位置不能动,手动创建对应目录,准备好下一步创建 secert
$ mkdir -p /etc/prometheus/secrets/etcd-client-cert
$ cd /etc/prometheus/secrets/etcd-client-cert
$ cp /etc/kubernetes/ssl/etcd.pem ./etcd-client
$ cp /etc/kubernetes/ssl/etcd-key.pem ./etcd-client-key
$ cp /etc/kubernetes/ssl/ca.pem ./etcd-ca
$ tree -L 1 .
.
├── etcd-ca
├── etcd-client
└── etcd-client-key

0 directories, 3 files
- 创建名为
etcd-client-cert的secret,这个etcd-client-cert必须对应于kube-prometheus-stack.values配置中存放证书目录的最后一段(代表secret名字):
$ cd /etc/prometheus/secrets/etcd-client-cert
$ kubectl create secret generic etcd-client-cert -n monitoring --from-file=etcd-ca --from-file=etcd-client-key --from-file=etcd-client
secret/etcd-client-cert created

# 检查证书密钥文件
$ kubectl get secrets -n monitoring etcd-client-cert -o yaml
...
data:
  etcd-ca: XXXXX
  etcd-client: XXXXX
  etcd-client-key: XXXX
执行 Helm 更新
$ helm upgrade prometheus -n monitoring -f values.yaml .
Error: UPGRADE FAILED: rendered manifests contain a resource that already exists. Unable to continue with update: Endpoints "prometheus-kube-prometheus-kube-etcd" in namespace "kube-system" exists and cannot be imported into the current release: invalid ownership metadata; annotation validation error: missing key "meta.helm.sh/release-name": must be set to "prometheus"; annotation validation error: missing key "meta.helm.sh/release-namespace": must be set to "monitoring"

# 这个报错是默认安装的时候,安装了 prometheus-kube-prometheus-kube-etcd 的endponits
$ kubectl get ep -n kube-system
NAME                                                 ENDPOINTS                                                              AGE
kube-dns                                             172.20.234.193:53,172.20.234.193:53,172.20.234.193:9153                10d
kube-dns-upstream                                    172.20.234.193:53,172.20.234.193:53                                    10d
metrics-server                                       172.20.248.129:4443                                                    10d
node-local-dns                                       192.168.1.60:9253,192.168.1.61:9253,192.168.1.62:9253 + 1 more...      10d
prometheus-kube-prometheus-coredns                   172.20.234.193:9153                                                    20h
prometheus-kube-prometheus-kube-controller-manager   <none>                                                                 20h
prometheus-kube-prometheus-kube-etcd                 <none>                                                                 20h
prometheus-kube-prometheus-kube-proxy                <none>                                                                 20h
prometheus-kube-prometheus-kube-scheduler            <none>                                                                 20h
prometheus-kube-prometheus-kubelet                   192.168.1.60:10250,192.168.1.61:10250,192.168.1.62:10250 + 9 more...   20h

# 可以看出来后续监控 kube-scheduler、kube-proxy、kube-controller-manage,都是需要先删除ep
修改 values.yaml 关闭 kube-etcd、kube-scheduler、kube-proxy、kube-controller-manage 的 endpoints
## Component scraping etcd
##
kubeEtcd:
  enabled: false
...
## Component scraping kube scheduler
##
kubeScheduler:
  enabled: false
...
## Component scraping kube proxy
##
kubeProxy:
  enabled: false
...
## Component scraping the kube controller manager
##
kubeControllerManager:
  enabled: false
执行更新命令,确认 endpoints 移除
$ helm upgrade prometheus -n monitoring -f values.yaml .
Release "prometheus" has been upgraded. Happy Helming!
NAME: prometheus
LAST DEPLOYED: Fri Mar 15 14:50:11 2024
NAMESPACE: monitoring
STATUS: deployed
REVISION: 4
NOTES:
kube-prometheus-stack has been installed. Check its status by running:
  kubectl --namespace monitoring get pods -l "release=prometheus"

# 查看 endpoints
$ kubectl get ep -n kube-system
NAME                                 ENDPOINTS                                                              AGE
kube-dns                             172.20.234.193:53,172.20.234.193:53,172.20.234.193:9153                10d
kube-dns-upstream                    172.20.234.193:53,172.20.234.193:53                                    10d
metrics-server                       172.20.248.129:4443                                                    10d
node-local-dns                       192.168.1.60:9253,192.168.1.61:9253,192.168.1.62:9253 + 1 more...      10d
prometheus-kube-prometheus-coredns   172.20.234.193:9153                                                    20h
prometheus-kube-prometheus-kubelet   192.168.1.60:10250,192.168.1.61:10250,192.168.1.62:10250 + 9 more...   20h
重新调整 values,启动 etcd 配置,并更新组件
$ kubectl get ep -n kube-system  | grep -E 'NAME|etcd'
NAME                                   ENDPOINTS                                                              AGE
prometheus-kube-prometheus-kube-etcd   192.168.1.60:2379                                                      69s
# kube-etcd 的endpoints 已经创建,后端的值已经匹配,是etcd所在的节点
登录 grafana 查看是否获取到数据
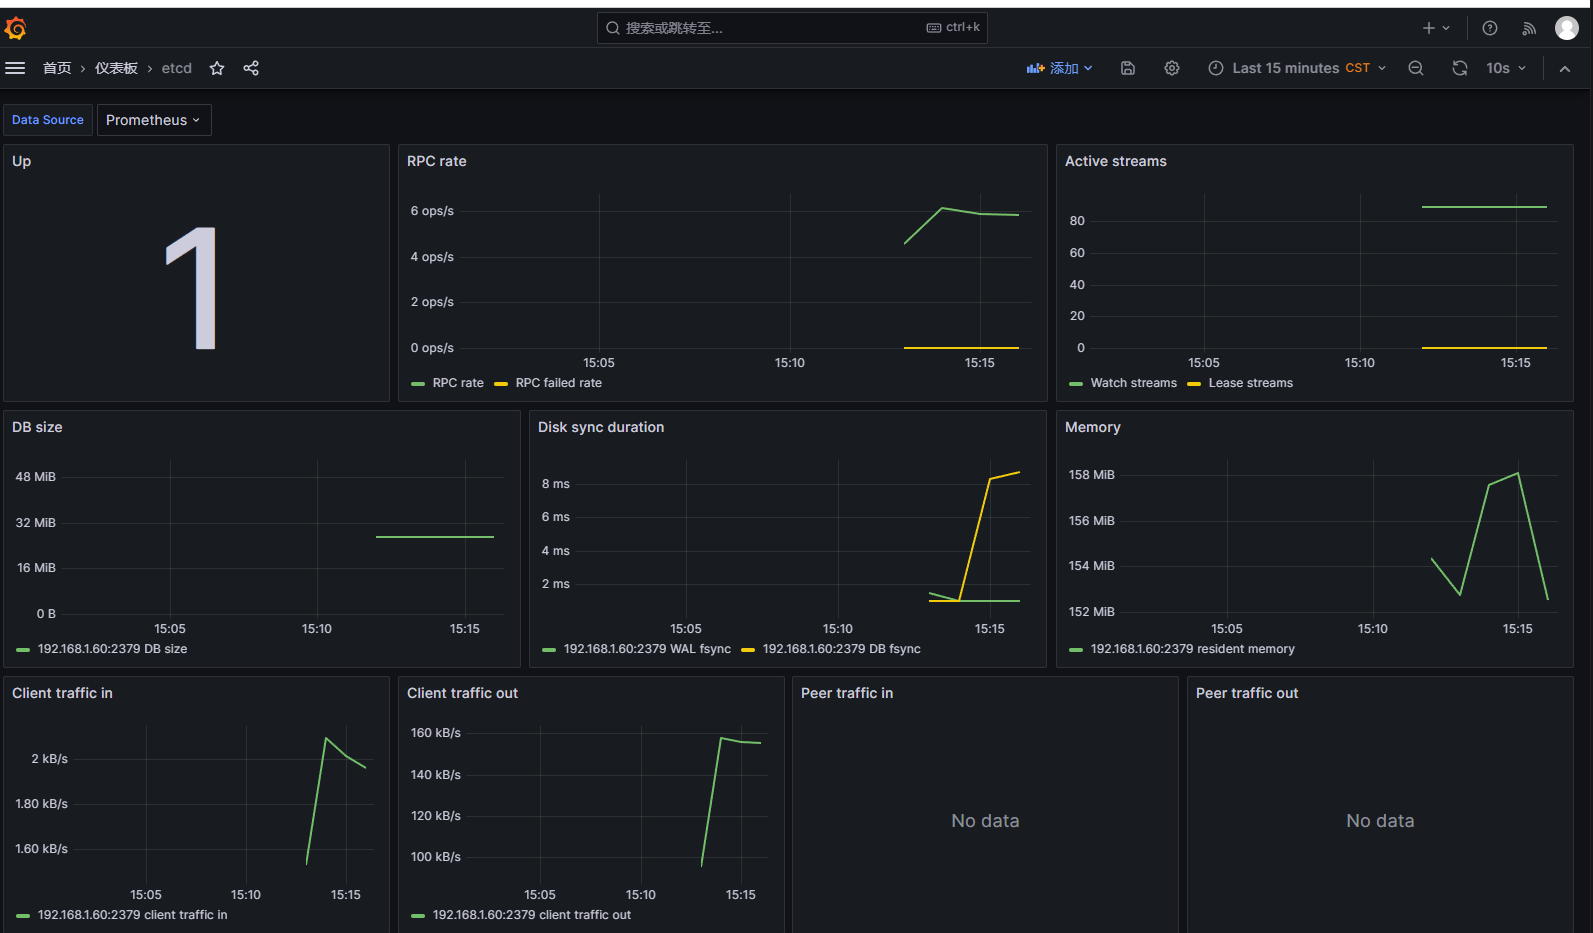
使用 Prometheus Stack 监控 Etcd
http://www.qiqios.cn/2024/03/15/使用-Prometheus-Stack-监控-Etcd/